Teams, teaching, travel and a new reflection tool – Fall recap
Teams, teaching, travel, and a new reflection tool – it’s been a busy Fall 2017! I’m feeling so inspired by the incredible organizations and people I’ve worked with recently, and wanted to share some of the techniques we used together. There’s a variety of approaches one can use to lead visually: from graphic recording for public engagements, to engaging groups with graphic facilitation, to modelling visual thinking tools, and knowledge translation with illustration.
TEACHING VISUAL FACILITATION
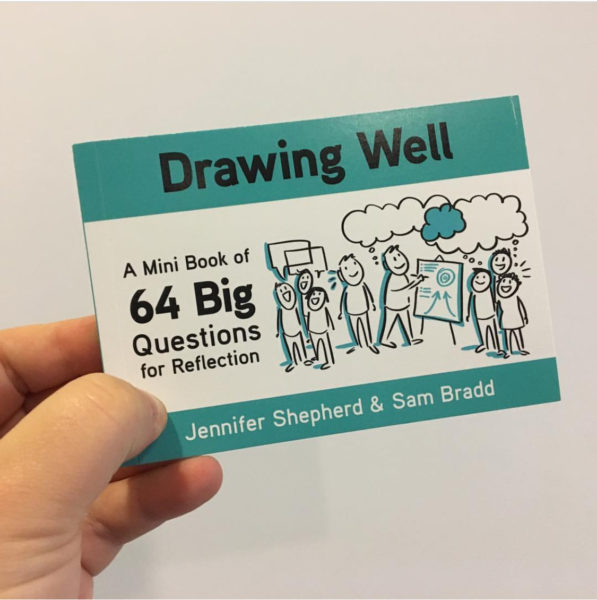
Drawing Well is online! Drawing Well is a new tool for visual practitioners and facilitators, and we put an excerpt online from our book – Sam Bradd & Jennifer Shepard – Drawn Together Through Visual Practice – 64 Questions to help reflect and transform how well you draw. Consider it an early holiday gift from us to you.
Vancouver, BC – Drawing Change Graphic Facilitation Workshop
Drawing Change held a two-day graphic recording and graphic facilitation workshop, helping people think and draw through complexity. Participants came from across three countries to engage and inspire each other.
There is a real struggle out there to be able to tap into, and sustain, our personal creativity in our professional lives – if you are able to know how to USE your creativity on a daily basis and know how to access it, consider yourself very lucky. Many people wrestle with how to find it when they need it. It might be 5% inspiration/95% perspiration, but it’s still something I trust I can rely on.
The best part of teaching – learning alongside each other. I personally learned new facilitation metaphors from the participants that were applicable to diverse work and contexts: e.g. a strategic planning template that used Indigenous beadwork designs to structure the page (way to go Jeska Slater). Big thanks to Avril Orloff, Yolanda Liman and Michelle Buchholz for leading sessions, too.
Want to join us next time?
I’m keeping a wait list for the next intro workshop in Spring 2018.
Are you already working visually? A new workshop has just gone up for Visual Practitioners with 2+ experience in February 2018, at the Ace Hotel in Portland Oregon, in collaboration with Sophia Liang.
Geneva Switzerland – World Health Organization (WHO)
I was happy to return to Geneva for this project. Over a few days, we worked deeply on important curriculum involving infectious diseases and epidemics. The thing about public health is that winning means…nothing happens! You can view this curriculum by signing up for the free Open MOOC courses online.


Graphic Recording
Kamloops, B.C. – National Indigenous Fisheries Institute
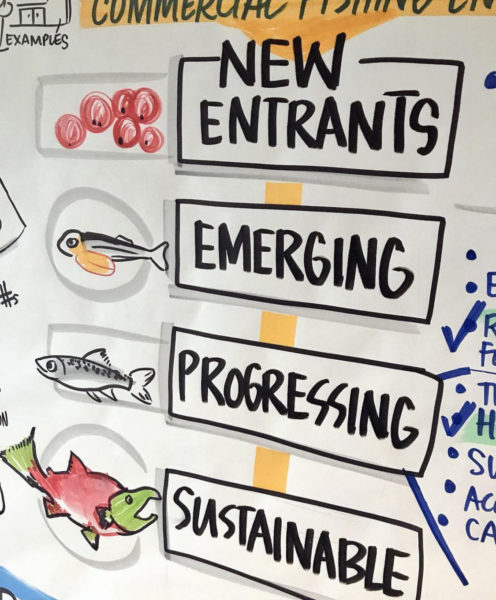
We travelled to Kamloops to participate in two days of graphic facilitation with the National Indigenous Fisheries Institute. The images/posters from this meeting are great examples of how you can use a visual language the client already understands, to further illustrate your key points. In this case, the lifecycles of the salmon were a useful way to explain the categories of our discussions:
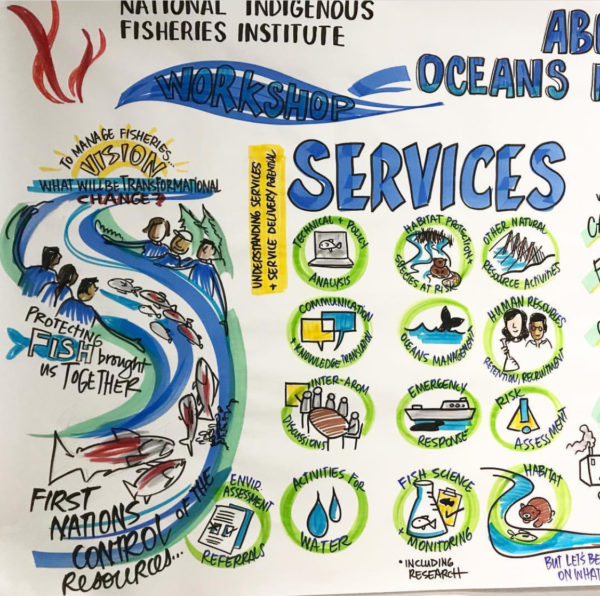
The second image, below, is a poster mapping what services exist, and then the identification of funding opportunities. The conversation was grounded in land – where all wealth (money and not-money) comes from.
Brussels, Belgium – 4th International Neonatal & Maternal Immunization Symposium
This symposium used graphic recording to distill a large amount of complex, highly specific information, and the large volume of slides meant we needed a super organized graphic recording layout. Lucky for us, cartoons are popular in Brussels, so our scientific drawings were well-received!

Yellowknife, Northwest Territories & Winnipeg, Manitoba
Anti-racism and reconciliation is the biggest conversation we need to have in Canada. I can’t emphasize enough how important it is to keep learning and to be willing to make mistakes, and keep trying; otherwise, nothing is going to change fast enough. We all need to create the conditions where people are willing to ask questions, feel secure enough to ask for help, and keep building relationships. That’s how we’re going to work towards implementing the Calls to Action in the Truth and Reconciliation report.
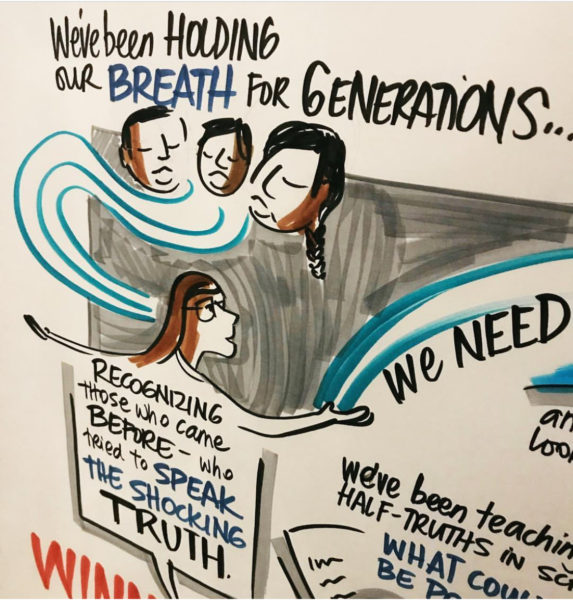
“We’ve been holding our breath for generations – we need results.”
Quotes like this go right to the heart, and I hope the decision-makers are listening.
During a discussion about anti-Indigenous racism and reconciliation, I heard and drew this image above, as a reference to her ancestors giving the woman strength through her hands and looking forward.
The illustration below comes from our discussions held at the Canadian Museum of Human Rights. Many museums across the country, and internationally, have made great changes in how they collaborate with, and are inclusive to, originating communities – particularly in regards to access and repatriation of Indigenous artworks and objects from their collections. As places of learning, they can expand the public memory, bring in diverse voices, and incorporate new ways of seeing into discussions that can affect our world.

Visual Facilitation
Boston, Massachusetts
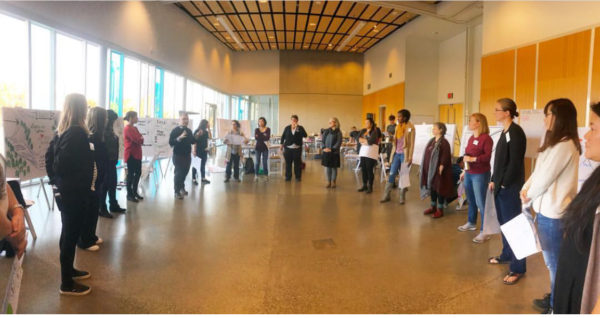
This was a team graphic facilitation project, and is one of my favourite types of projects. We were a team of 10 scribes to help debrief small groups, and engage them as their facilitator. Our first task was to help groups identify the key learnings from their program, and then our second task was to create a visual take-away from what they were going to do next as leaders. The graphic facilitation makes sense of rich and complex information.
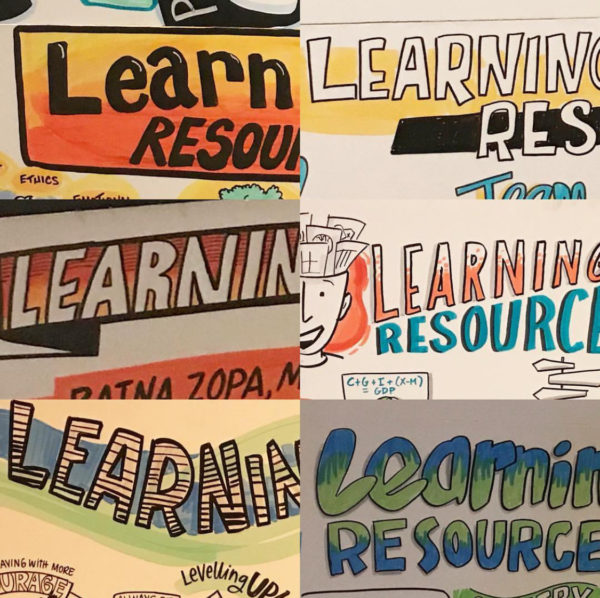
As a practitioner, it’s fun to work in a big team. Here you can see the same title done six different ways. My submissions are the top right and bottom left. Often we do this work solo, and reflection is a key part of delivering clear and useful results, like a good editor pointing out what works and what can be taken away. After we finished our work, and went for dinner – three of us came back and did our own little “gallery walk” of what we appreciated of our colleagues’ work!
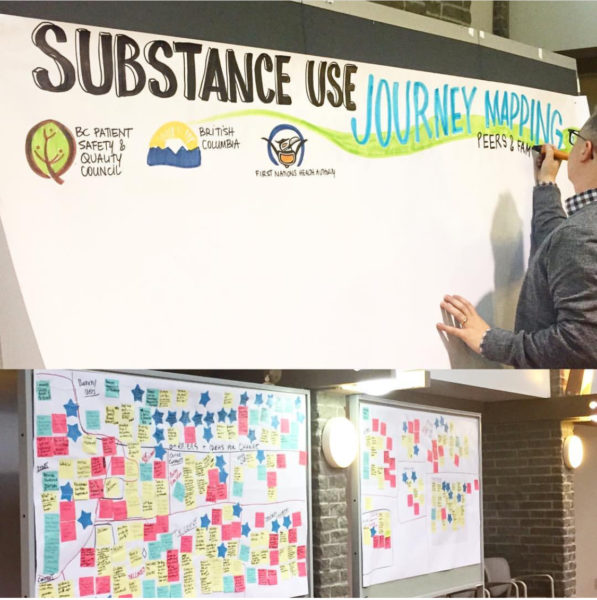
Vancouver, B.C. – BC Patient Safety and Quality Council
Here we used journey mapping around substance abuse, as a tool to effectively explore and understand the Indigenous peer and health care provider lived experience around the opioid crisis in B.C. Facilitators led small and large groups through a mapping process, which resulted in the post-it notes below.
This project was all about layering in the information: it went from journey mapping to graphic recording, and as a next step all of this information is going to inform some very polished, digital infographics.
Ottawa, Ontario – Digital Youth Summit
This design thinking workshop at the Digital Youth Summit, was particularly rewarding as we engaged with an almost-full room of women in tech! Incredible. Young people inventing, designing, and making their own dream jobs.
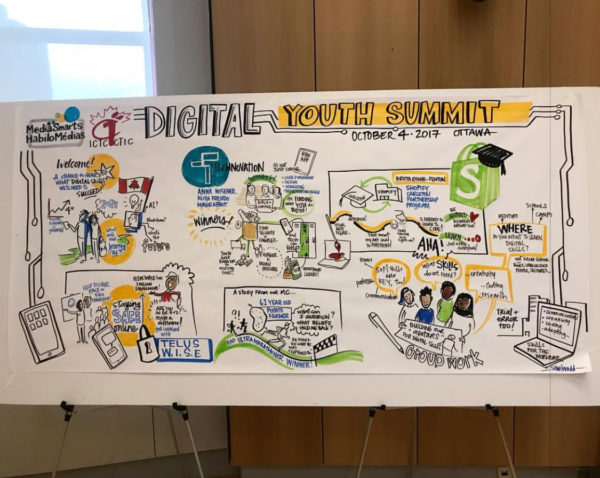
We used templates for the group work, which I”ve written about before – so I’ll share a tip for capturing short, 6 – 8 minute presentations:
- Keep moving.
- Draw one anchor image + key phrases for what the problem is + end with their unique solution.
- Don’t try to explain all the details about the problem they’re trying to solve.
- Make sure you leave space for what their big idea is – even if it comes at the end of what the speaker is saying.
Victoria, B.C. – Team Visioning Event
This was a team visioning evening event with Colleen Stephenson, Tanya Gadsby, and Minh Ngo. It was an evening meeting – so it had to be super interactive. This is what we did:

- After an opening activity that generated wide, broad ideas, we each took a small group for live graphic facilitation.
- Each group focussed on one topic, so we could go deeper into four topics. Then the fun part –
- As participants had dinner, the four of us got to work synthesizing and making connections from all the data and drew out a big group summary poster in 2 hours (!), and presented it at the end of the night – total success!

I have a few more things to wrap before the end of 2017 … stay tuned for the return of “reflections from the field” from visual facilitation colleagues, too.