My new infographic for the Canadian Centre for Policy Alternatives-BC shows how Zero Waste policies can reduce greenhouse gas emissions and create green jobs. The CCPA-BC office has released a brand new report detailing statistics and recommendations for how we can shift from linear waste systems to closed loop systems. Linear waste is the usual … Read more Zero Waste infographics for the CCPA
I contributed four infographics for the Columbia Institute to present at the Green Jobs BC Conference. Held September 21-22, 2012, it’s “an alliance between BC’s Environmental and Labour movements to build a green economy in BC.” Web versions of the files are below; printed copies were handed out along with the delegate packages. The organizers … Read more Infographics for Green Jobs BC Conference
What’s the best thing to do with graphic recording images after a meeting? Use them! But how? Meetings are a major investment in time and effort. You may have invited graphic recording to help you: inform* people about something, consult and get feedback, involve key groups in discussion or refining ideas, collaborate in decision-making, or … Read more Get the most value from your graphic recording – after your meeting
What’s the best thing to do with graphic recording images after a meeting? Use them! But how? Meetings are a major investment in time and effort. You may have invited graphic recording to help you: inform* people about something, consult and get feedback, involve key groups in discussion or refining ideas, collaborate in decision-making, or … Read more Get the most value from Graphic Recordings – after your meeting
Today a client asked me, “what’s the best knowledge translation project you’ve ever worked on?” And without a beat, I knew: “the kind where people who are affected by the research, are involved from the beginning.” Here are some recommendations and samples of knowledge translation projects to inspire your next research project. It’s never one … Read more Visual Knowledge Translation Projects
Beyond the Basics with Graphic Facilitation The graphic facilitation and graphic field is booming – are you getting the work you want? Sophia Liang and Sam Bradd designed this course to teach what they wish someone had taught them when they started out as graphic facilitators. Experts say, in order to scale or grow your … Read more 2018 Beyond the Basics: Graphic Facilitation Workshop in Portland, Oregon
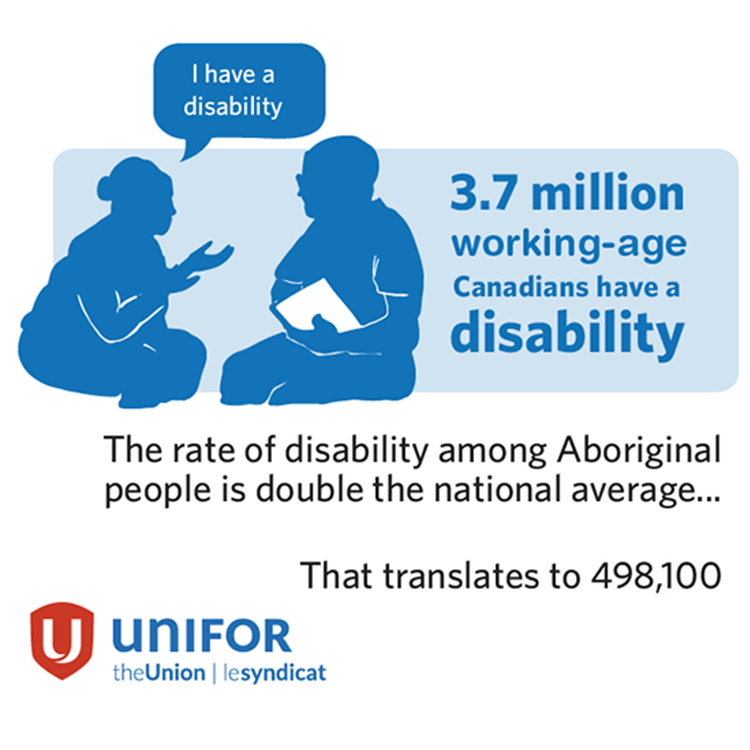
Client Unifor, Workers with disAbilities Project Support Unifor’s awareness initiatives to help achieve dignity for workers with disabilities. Solution Custom infographics that communicates information, like statistics and simple workplace accommodations, that encourages integration and equal opportunity. Result Easy to understand infographics to share widely across union and public spaces.
Teams, teaching, travel, and a new reflection tool – it’s been a busy Fall 2017! I’m feeling so inspired by the incredible organizations and people I’ve worked with recently, and wanted to share some of the techniques we used together. There’s a variety of approaches one can use to lead visually: from graphic recording for public … Read more Teams, teaching, travel and a new reflection tool – Fall recap
I was recently asked a great question by !Kona: “When you think of all the conversations where you are present as a graphic recording witness, do you have any current large scale thoughts about human nature, communication, or wants and desires?” As graphic recorders and graphic facilitators, we’re privileged to work in fascinating sessions, but it’s often behind … Read more 2016 Wrap-Up: Graphic Recorders Reflect on Human Nature and Communication
Here are some positive visuals to support gender-affirming health care. The first is a new visual strategic plan for Trans Care BC. These three small drawings tell a bigger story, and are the foundation to the infographic (designed by Karianne Blank). Established in 2015 as a program of the Provincial Health Services Authority, Trans Care … Read more Trans Care BC – Strategic Infographic & The Remedy
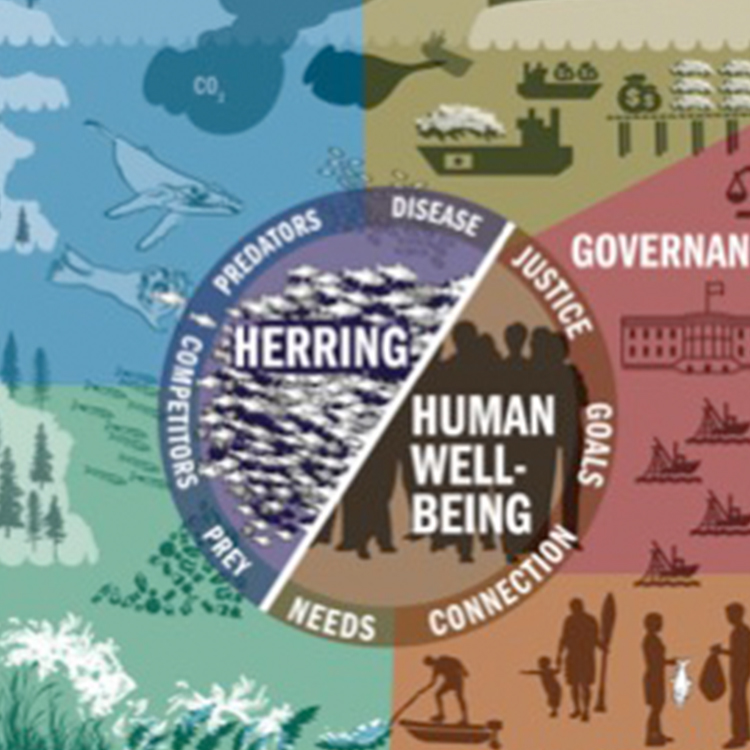
CLIENT Ocean Modelling Forum PROJECT Ocean Modelling Forum with graphic recording, and then a resulting infographic. This one infographic asks 32 questions: the new Conceptual Model of the Herring Social-Ecological System. SOLUTION This participatory process began at the Pacific Herring Summit in 2015. Participants set collaborative priorities and engaged in group work to create a conceptual model linking social-ecological systems (SES). After the event, I received … Read more Social-ecological model of herring infographic
CLIENT Sierra Club of BC PROJECT Show a thriving, vibrant low carbon future and engage young people. SOLUTION The poster is part of the Sierra Club of BC’s new report The Future is Here, an “urgent call to defend nature, stabilize the climate, and transition to a post-carbon economy.” And a low carbon future can sound very serious, … Read more Low Carbon Infographic for Sierra Club
New First Nations data is now available. Now is the Time is a brand new report with about First Nations communities, thanks to the First Nations Information Governance Centre. FNIGC writes that Now is the Time: Our Data, Our Stories, Our Future,The National Report of the First Nations Regional Early Childhood, Education and Employment Survey is “The most … Read more Visuals to communicate new data about First Nations Communities
Data isn’t just numbers, it’s stories. The first-ever First Nations Regional Early Childhood, Education and Employment Survey (FNREEES) tells a new story: “unprecedented insight into life in First Nations on-reserve and northern communities in Canada”. When the FNREEES was published, we had the privilege of creating infographics and graphic recordings with the First Nations Information … Read more Data is more than numbers — it’s stories – with FNIGC
I’m in Victoria, BC to judge the 2015 Canadian Association of Labour Media awards once again. I evaluated the visual categories including best poster, best infographic/illustration and best overall print excellence. Congratulations to everyone – there were so many excellent submissions that we had a tie and numerous honorable mentions. The poster category blew me away. Have you … Read more Judging the 2015 CALM awards: Canadian Association of Labour Media